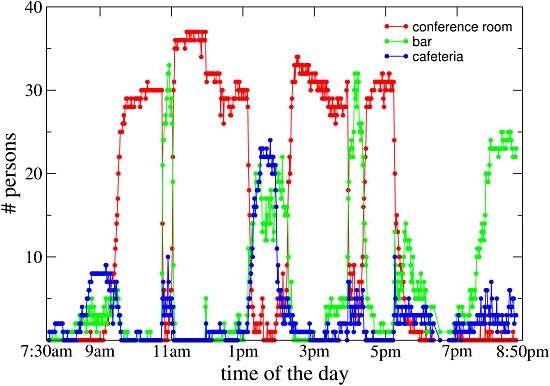
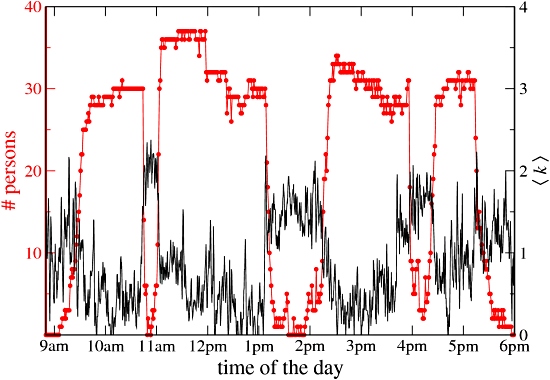
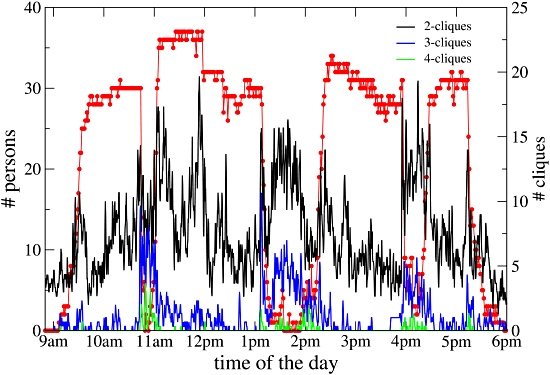
Social interactions at a conferencePublished: November 7, 2008 High-resolution localization of active RFID devices by means of triangulation is a non-trivial task. However, a more coarse-grained localization, by room for example, is easily feasible. There were three main ‘rooms’ at the “Facing the Challenge of Infectious Diseases” conference: the conference room, the bar and the cafeteria. The following figure shows how many participants were in which of these three locations over the course of one day of the conference. It clearly shows the attendance in the conference room during the sessions (two in the morning and two in the afternoon) and the shifts to the bar during the coffee breaks and the cafeteria during breakfast and lunch. The social event taking place in the bar after 7.30 pm is also visible. Correlating this location data with the contact data can offer a more interesting picture than the simple attendance figures for seminars or social events. One approach is to aggregate the contact data over discrete time intervals. For each interval we can then calculate measures such as the average number of contacts of each participant, or their average duration. When plotted over time, these measures provide insights into the temporal evolution of the social dynamics of the group as a whole. The following figure is an example of this. In it we compare the average number of contacts per participant, denoted <k>, measured over 20 seconds time windows, with the number of participants that are present in the conference room. Strikingly, the number of contacts per participant is low when the attendance in the conference room is high. A strong increase of the average number of contacts per participant is observed during each break. This clearly shows how most social interactions occur during the coffee and lunch breaks, while a lower level of interaction takes place during the talks: people talking to their immediate neighbor, typically. Another more detailed approach is to gather for each interval the average number of distinct contact pairs, contact triangles, and contact cliques with four or more participants. In the following figure we again plot these measures over the course of one day. We see that triangles and cliques of 4 individuals almost exclusively occur during the breaks. A fluctuating number of pairs is observed during the session, corresponding most probably to participants turning towards their neighbors to chat or comment. Peaks are observed at the beginning and end of each session and in fact of each talk, when participants have indeed more activity. The small number of triangles observed during the sessions correspond to small groups of participants remaining in the coffee break area for discussions even after the beginning of the session. That social interactions take place during breaks is certainly not a surprise nor a novelty: these results are clearly expected. Our aim here is to emphasize how our experimental setup is able to characterize face-to-face interaction and not simply spatial proximity. A simpler setup based on physical proximity alone would show a large number of cliques (or even a unique large clique) during the sessions, in which participants are indeed physically close. Here, in contrast, we are able to detect meaningful social contacts, and also discriminate between pair interactions or discussions in small groups of 3, 4 or 5 persons. |
NEWS |
![SocioPatterns [logo]](http://www.sociopatterns.org/wp-content/themes/sp2/images/header_logo.png)


