DEPLOYMENT: 25C3
Event descriptionThe 25th Chaos Communication Congress (25C3) was the 2008 edition of the annual four-day conference organized by the Chaos Computer Club (CCC). It took place at the Berliner Congress Center (BCC) in Berlin, Germany. The Congress offers lectures and workshops on a multitude of topics and attracts a diverse audience of thousands of hackers, scientists, artists, and utopians from all around the world. The 25C3 slogan was “Nothing to hide.” [source: 25th Chaos Communication Congress website, 2008]. Deployment descriptionFollowing the successful deployments of the SocioPatterns Monitoring Platform at the ISI offices and Epiwork workshop, we were looking for an opportunity to deploy the platform at a much larger scale in order to confirm its scalability and to obtain a larger dataset to analyse and compare with the datasets collected during the previous deployments. Consequently, we gladly accepted the offer by OpenBeacon.org to participate in the Sputnik deployment at the 2008 edition of the Chaos Communication Congress, an event that attracts thousands of participants.  Left: the iconic Berliner Congress Center with the even more iconic C3 rocket in front of it. Right: the Sputnik poster. The hardware and infrastructure for the resulting deployment was provided by Bitmanufaktur. As they had already deployed their system during previous CCC events, they had sufficient experience to successfully deal with the non-trivial infrastructure requirements implied by the scale of the event. A total of thirty-five RFID readers were installed in the publicly accesible areas of the venue. The badge firmware developed by the SocioPatterns project was used and the face-to-face proximity detection and reporting messages were processed by a high-performance aggregator, the results of which were used by both the SocioPatterns and OpenAMD service layers. The inherent “hostile” context of the event due to the presence of hundreds of highly skilled hackers/crackers, which tend to be particularly interested in system security and privacy matters, enabled us to assert the solidity of the privacy protection measures implemented in the SocioPatterns Platform. If it could survive a deployment at C3, it could pretty much survive everything. In line with the conference’s action line “nothing to hide”, we made the live contact network available on the web. VisualizationsAs we expected that the usefulness of a visualization of the complete face-to-face proximity network at this deployment would suffer because of its size, we developed some experimental visualizations that focussed on subsets of the real-time and cumulative contact networks. User focus viewThe most successful of these experimental visualizations focussed on a particular participant and showed a related subset of the instantaneous as well as of the cumulative network. These subsets included for each network the first and second-degree neighbors, or in other words, all participants that have been or are in contact with the central user, as well as all the participants these first-degree neighbors have been or are in contact with. All edges between the included participants were also included in the shown network. These edges were colored according to which network the occur in, where the presence in the instantaneous network took precedence. The following figure shows an example of the resulting visualization. The user that is focussed upon is represented by a large yellow labeled mark situated in the center of the visualization. All other participants are represented as white labeled marks. The labels show either the id of the badge worn by the respective participant or his or her nickname, when given through the provided web interface. The edges that occur only in the cumulative network are shown in a bluish grey, while the edges representing ongoing contacts are shown in yellow. The thickness of an edge is a function of its weight in the respective network. Note that the labels shown in this figure are taken from a random list of names.  Example of user focus visualization. Click to view at full size. This visualization was provided on a publicly accessible webpage as an embedded Flash application. An included interface allowed the users to focus on a participant by entering the corresponding badge id or the nickname when given. This application turned out to offer a number of not entirely anticipated affordances, the essence of which is in social science sometimes referred to as closing the triangle, i.e., established a link between two nodes which are both connected with a third. Multi-user focus viewA second approach we considered was to focus on multiple user simultaneously. Here we restricted the included nodes to the direct neighbors of the focus participants. The following figure shows an demo of this visualization. The focus participants are again represented by large yellow labeled marks laid out equiangularly on a circumcentric oval. The other participants and contact edges are represented in the same way as in the previous visualization.  Example of the multi-user focus visualization. Click to view at full size. Acknowledgements
|
NEWSNew data sets published: co-presence and face-to-face contactsThrough a publication in EPJ Data Science, we have released several new data sets of different types. These datasets can be found on Zenodo. On the one hand, we have released new temporally resolved data on face-to-face interactions collected in
In addition, we release data sets describing the temporally resolved co-location of individuals, where co-location of two individuals at time t means that the same exact set of readers have received signals from both individuals at time t. Data can be found on our website or on Zenodo. Obviously, the co-location data corresponds to a coarser spatial resolution than the face-to-face data, and we have compared the corresponding data in terms of structure and when used in data-driven simulations of disease propagation models in our paper.
SocioPatterns: measuring animal proximity networksAfter so many measurements concerning humans in different contexts (which we will continue measuring), SocioPatterns has partnered with different institutions to measure proximity networks of animals, ranging from free-roaming dogs to sheep and cows. The goals of the studies range from the study of social networks of animals to the development of better models of disease transmission in animal groups.
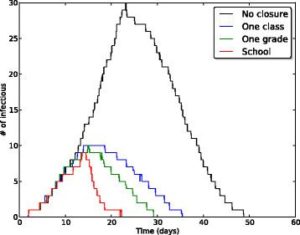
School closures to mitigate influenza spread: two studies based on SocioPatterns dataIn order to fight and mitigate emerging epidemics, non-pharmaceutical interventions can become necessary. Among these, school closure is typically regarded as a viable mitigation strategy: children indeed are known to play an important role in the propagation of infectious diseases, due to their high rate of contacts at school. School closure is however a costly measure whose applicability remains uncertain and whose implementation should carefully be weighed on the basis of cost-benefit considerations. In two successive studies published in BMC Infectious Diseases, we have used high resolution data on the contact patterns of children that we collected in a primary school,(i) to define and investigate alternative, less costly mitigation measures such as the targeted and reactive closure of single classes whenever symptomatic children are detected, at the scale of a single school and (ii) to evaluate the effectiveness of several such gradual reactive school closure strategies at the scale of entire municipalities. Our results highlight a potential beneficial effect of reactive gradual school closure policies in mitigating influenza spread. Moreover, the suggested strategies are solely based on routinely collected and easily accessible data (such as student absenteeism irrespective) and thus they appear to be applicable in real world situations. References: Mitigation of infectious disease at school: targeted class closure vs school closure
SUPPORTED BY |
|
|