DEPLOYMENT: Epiwork workshop
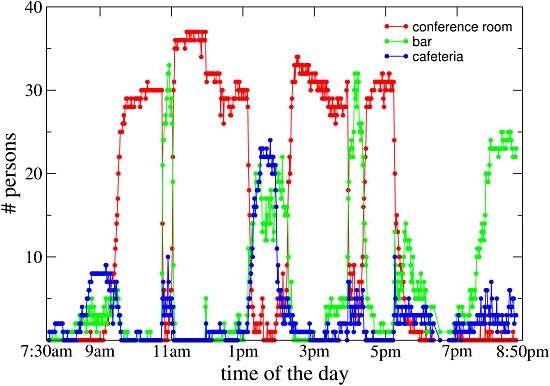
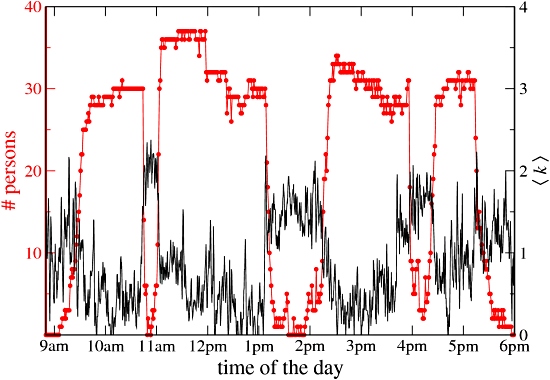
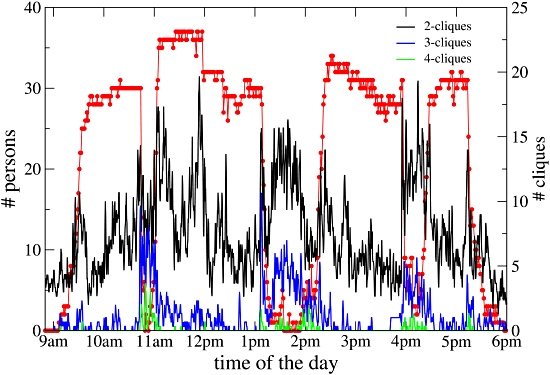
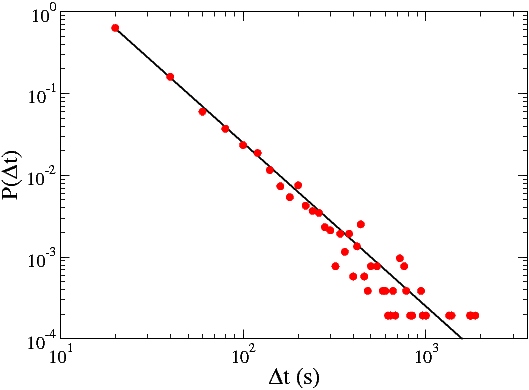
Deployment descriptionThis was the second deployment of the fully-fledged SocioPatterns sensing platform, which is described in detail in the description of its first deployment. All participants of the workshop were proposed to participate in the SocioPatterns deployment and most gladly accepted. This workshop took place at the same location as the SocioPhysics workshop, i.e., Villa Gualino in Turin, Italy. This enabled us to compare the behavior and results of the SocioPatterns sensing platform versus the pilot sensing technology deployed during this SocioPhysics workshop. Since the new platform does not rely on the reception of the beacon signals by multiple readers, we did not need to install as many readers as for the SocioPhysics workshop deployment. The following map of the conference floor of Villa Gualino shows the location of the eight installed readers. 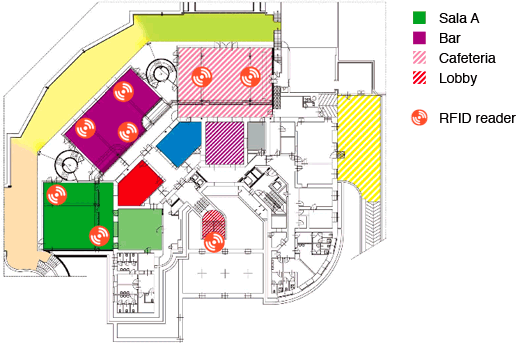 The location of the installed RFID readers in the rooms used for the workshop. VisualizationFor this deployment we developed two visualizations. The first showed the instantaneous face-to-face proximity network (the current state of the network) similar to the visualization developed for the earlier SocioPhysics workshop deployment. Comparing the visualizations of the instantaneous network obtained through the new sensing platform with that obtained with the initial proximity-only system used for the SocioPhysics workshop deployment, clearly shows the difference. The following figure shows a side by side comparison of the networks, the one on the left for the SocioPhysics workshop deployment around 11:30 AM on May 27, 2008, and the one on the right for the Epiwork workshop deployment around 11:00 AM on October 15, 2008. Both show the network while the people were gathering in the bar during the coffee break. The visualization on the left clearly shows an almost fully connected network since it shows edges between participants that were spatially near each other. The network on the right, however, is much more sparse, since it only has edges between participants that were facing each other while being near each other. The network on the right is clearly a much better approximation of the actual person-to-person interaction network. 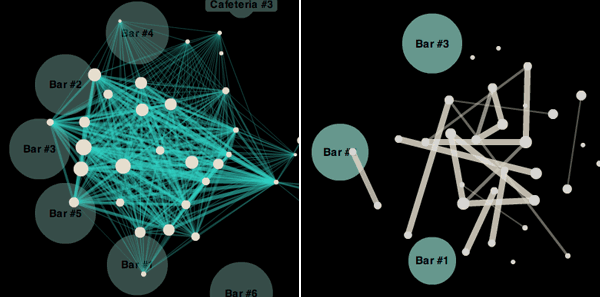 Side by side comparison of the instantaneous networks obtained through the initial proximity-only sensing technology (left) and the fully-fledges SocioPatterns sensing platform (right). The following movie shows the instantaneous face-to-face proximity network obtained through the SocioPatterns sensing platform, for some selected periods of one day of the workshop. A time-lapsed playback of the visualization of the instantaneous face-to-face proximity network as obtained through the SocioPatterns sensing platform, for some selected periods of one day of the SocioPhysics workshop. The second visualization showed the cumulative network, which was obtained by cumulating all face-to-face proximity relations detected since the beginning of the respective day. To enable the observer to focus on the significant interactions in the otherwise highly connected cumulative network, the summed edge weights were logarithmically reweighed to compensate for the long-tail nature, and only the edges with a weight exceeding a certain threshold were retained. Both visualizations offered a “live” continuously updated representation of the network thanks to the real-time proximity detection and processing capabilities of the sensing system, the real-time stream of network updates dispatched to the visualization client, and the dynamic force-directed layout algorithm. They were shown on two publicly displayed screens in the bar area as shown in the following figure.  The two visualizations shown on two publicly displayed screens installed in the bar. The left-hand screen shows the instantaneous network while the other screen showed the cumulative network. The badge marks in these visualizations were annotated with the name of the participant associated with the respective badge. This not only enabled the viewers to identify their representations in the visualization, as well as those of other participants, but also allowed them to roughly locate other participants as their representations were positioned near the labeled marks of the readers they were physically closest to. Note that the names are not shown in the time-lapsed extracts shown in the above movie in accordance with our privacy protocols. Results: Interaction activity analysisWhat follows is an example of a study of the data obtained through the SocioPatterns sensing platform. Thanks to the ability to roughly locate each participant by looking at which readers received which messages from the badge of that participant, we can investigate the social activity per room, as well as its evolution over time. We consider the three main ‘rooms’ in which the workshop participants were tracked: the conference room, the bar and the cafeteria. The following figure shows how many participants were in each of these locations over the course of one day of the conference, with time on the horizontal axis and the number of participants on the vertical axis. It shows the attendance in the conference room during the workshop sessions (two in the morning and two in the afternoon) and the shifts to the bar during the coffee breaks, and the cafeteria during breakfast and lunch. The social event taking place in the bar after 7.30 pm is also clearly visible. Correlating this location data with the data on non-technologically-mediated person-to-person interactions, henceforth referred to as contacts, can offer a more interesting picture than the simple attendance figures for seminars or social events. One approach is to aggregate the contact data over discrete time intervals. For each interval we can then calculate measures such as the average number of contacts of each participant, or their average duration. When plotted over time, these measures provide insights into the temporal evolution of the social dynamics of the group as a whole. The following figure is an example of this. In it we compare the average number of contacts per participant, denoted <k>, measured over 20 seconds time windows, with the number of participants that are present in the conference room. Strikingly, the number of contacts per participant is low when the attendance in the conference room is high. A strong increase of the average number of contacts per participant is observed during each break. This clearly shows how most social interactions occur during the coffee and lunch breaks, while a lower level of interaction takes place during the talks: people talking to their immediate neighbor, typically. Another more detailed approach is to gather for each interval the average number of distinct contact pairs, contact triangles, and contact cliques with four or more participants. In the following figure we again plot these measures over the course of one day. We see that triangles and cliques of 4 individuals almost exclusively occur during the breaks. A fluctuating number of pairs is observed during the session, corresponding most probably to participants turning towards their neighbors to chat or comment. Peaks are observed at the beginning and end of each session and in fact of each talk, when participants have indeed more activity. The small number of triangles observed during the sessions correspond to small groups of participants remaining in the coffee break area for discussions even after the beginning of the session. That social interactions take place during breaks is certainly not a surprise nor a novelty: these results are clearly expected. Our aim here is to emphasize how our experimental setup is able to characterize face-to-face interaction and not simply spatial proximity. A simpler setup based on physical proximity alone would show a large number of cliques (or even a unique large clique) during the sessions, in which participants are indeed physically close. Here, in contrast, we are able to detect meaningful social contacts, and also discriminate between pair interactions or discussions in small groups of 3, 4 or 5 persons. Results: Contact durationIn this second example of the kinds of analysis that can be performed on the data obtained through the SocioPatterns sensing platform, we look at the duration of contacts. The probability P(Dt) of observing a contact of duration Dt is shown as a function of the contact duration Dt. The probability distribution was computed using a few hours of data. The interval of time we analyzed was divided into slices of 20 seconds, and for each of these slices the contact graph of the attendees was computed and used to assess when a new contact was established, continued, or broken. As a consequence, the contact durations we measure are multiples of the interval used for temporal coarse-graining (i.e., contacts last 20 seconds, 40 s, 60 s, …) Remarkably, this simple analysis exposes a clear pattern of social contact: the duration of face-to-face contacts is power-law distributed (straight line on a log-log plot) with an exponent close to -2 (black line). This behavior holds over different periods of time, and is robust across different groups of individuals. Qualitatively, the figure above shows something obvious: there are comparatively few long-lasting contacts and a multitude of brief contacts. It is remarkable, however, that such a clear-cut pattern emerges when observing a few tens of persons over a few hours. Moreover, the specific value of the scaling exponent (-2) shows that the duration of social contact is scale-free, i.e., there is no “typical” duration for contacts. While one can always compute an average duration of contacts over a finite sample of data, the scaling properties are such that the computed average will increase without limit on increasing the length of the experiment. We close by noticing that we are not the first to observe this regularity for the duration of social contacts (see for example the work by Scherrer et al. on “Description and simulation of dynamic mobility networks”). Our measurements, however, achieve higher spatial and temporal accuracy than previous studies, and reliably select face-to-face interactions at close range, which are a very good proxy for social interaction. Acknowledgements
|
NEWSNew data sets published: co-presence and face-to-face contactsThrough a publication in EPJ Data Science, we have released several new data sets of different types. These datasets can be found on Zenodo. On the one hand, we have released new temporally resolved data on face-to-face interactions collected in
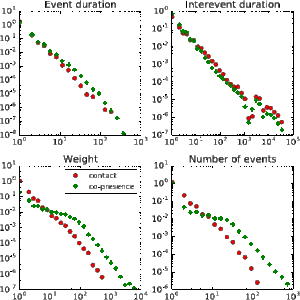
In addition, we release data sets describing the temporally resolved co-location of individuals, where co-location of two individuals at time t means that the same exact set of readers have received signals from both individuals at time t. Data can be found on our website or on Zenodo. Obviously, the co-location data corresponds to a coarser spatial resolution than the face-to-face data, and we have compared the corresponding data in terms of structure and when used in data-driven simulations of disease propagation models in our paper.
SocioPatterns: measuring animal proximity networksAfter so many measurements concerning humans in different contexts (which we will continue measuring), SocioPatterns has partnered with different institutions to measure proximity networks of animals, ranging from free-roaming dogs to sheep and cows. The goals of the studies range from the study of social networks of animals to the development of better models of disease transmission in animal groups.
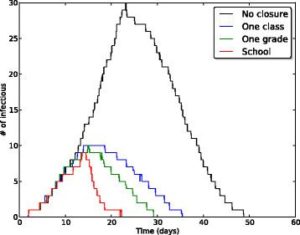
School closures to mitigate influenza spread: two studies based on SocioPatterns dataIn order to fight and mitigate emerging epidemics, non-pharmaceutical interventions can become necessary. Among these, school closure is typically regarded as a viable mitigation strategy: children indeed are known to play an important role in the propagation of infectious diseases, due to their high rate of contacts at school. School closure is however a costly measure whose applicability remains uncertain and whose implementation should carefully be weighed on the basis of cost-benefit considerations. In two successive studies published in BMC Infectious Diseases, we have used high resolution data on the contact patterns of children that we collected in a primary school,(i) to define and investigate alternative, less costly mitigation measures such as the targeted and reactive closure of single classes whenever symptomatic children are detected, at the scale of a single school and (ii) to evaluate the effectiveness of several such gradual reactive school closure strategies at the scale of entire municipalities. Our results highlight a potential beneficial effect of reactive gradual school closure policies in mitigating influenza spread. Moreover, the suggested strategies are solely based on routinely collected and easily accessible data (such as student absenteeism irrespective) and thus they appear to be applicable in real world situations. References: Mitigation of infectious disease at school: targeted class closure vs school closure
SUPPORTED BY
|
![SocioPatterns [logo]](http://www.sociopatterns.org/wp-content/themes/sp2/images/header_logo.png)
